



Most clinics don't have a data problem. They have a traceability problem.
You can pull a revenue-per-visit number, a vaccine compliance rate, or an average length-of-stay figure from your practice management system. But ask a simple follow-up — where did this number come from, which template field feeds it, and who decided it should be calculated this way — and the room goes quiet. The number exists. The chain of custody behind it doesn't.
That gap is the whole ballgame. A dashboard is only worth looking at if you can trace every tile back to a documented field, a validation rule, and a person responsible for keeping it accurate. When that chain is missing, you don't get bad decisions in some dramatic way — you get slow erosion of trust. Doctors stop believing the compliance report. The practice manager quietly rebuilds the numbers in a spreadsheet. And within a few months you're paying for analytics nobody uses.
This article covers the full pipeline — from the documentation template a technician fills out, all the way to a validated analytics dataset feeding a dashboard — and the operating model that keeps it honest as you grow. The phrase documentation to analytics veterinary isn't a buzzword; it's literally the path your data travels, and almost every failure happens somewhere along that path.
Why the pipeline breaks before anyone notices
The reason this is hard isn't technical. It's that documentation and analytics are usually owned by completely different people who never talk.
The technician filling out the dental chart cares about getting the patient out the door. The associate signing the record cares about clinical accuracy. The person building the monthly report cares about whether the fields are consistent enough to count. Nobody is responsible for the handoff between those worlds. So the template evolves one way, the report evolves another, and six months later the definitions have silently drifted apart.
A typical example: a clinic adds a free-text "recheck recommended?" box to its exam template because a doctor asked for it. Nobody tells the analytics side. The report tracking recheck conversion keeps pulling from the old structured checkbox — which half the staff stopped using once the new box appeared. The conversion rate on the dashboard starts dropping. Leadership assumes it's a front-desk follow-up problem and spends two months fixing something that was never broken. The real issue was a template change with no change-control.
This is the core pattern: documentation changes are clinical decisions, but they're also schema changes. Treat them as only clinical, and your analytics rot quietly.
The pipeline, laid out end to end
It helps to see the whole thing as discrete stages, each with its own failure mode. Here's the path a single data point travels.
Never miss a pet’s appointment again.
Veterinaryly helps you schedule, confirm, and manage every appointment and patient record effortlessly.
- Centralized appointment & patient management
- Automated client reminders
- Staff scheduling & task tracking
No credit card required
| Stage | What happens | Where it breaks |
|---|---|---|
| Template | Staff enters data into a documented field | Free-text where structured data is needed; duplicate fields for the same concept |
| Capture | The field saves into the PIMS/EMR | Required fields skipped; values entered in the wrong unit |
| Extraction | Data is pulled into an analytics layer | Field renamed upstream; extraction still points at the old name |
| Transformation | Raw values get cleaned and categorized | Mapping logic hardcoded, undocumented, known only to one person |
| Validation (QA) | Scripts check the dataset for sanity | No QA layer at all — errors flow straight to the dashboard |
| Dashboard | Numbers appear for decision-making | Tile has no definition; nobody can explain the calculation |
Notice that only one of these six stages is "the dashboard." Clinics obsess over the dashboard and ignore the five stages feeding it. That's backwards. A beautiful dashboard built on an undocumented transformation layer is just a confident way to be wrong.
Here's a simple workflow visualization.
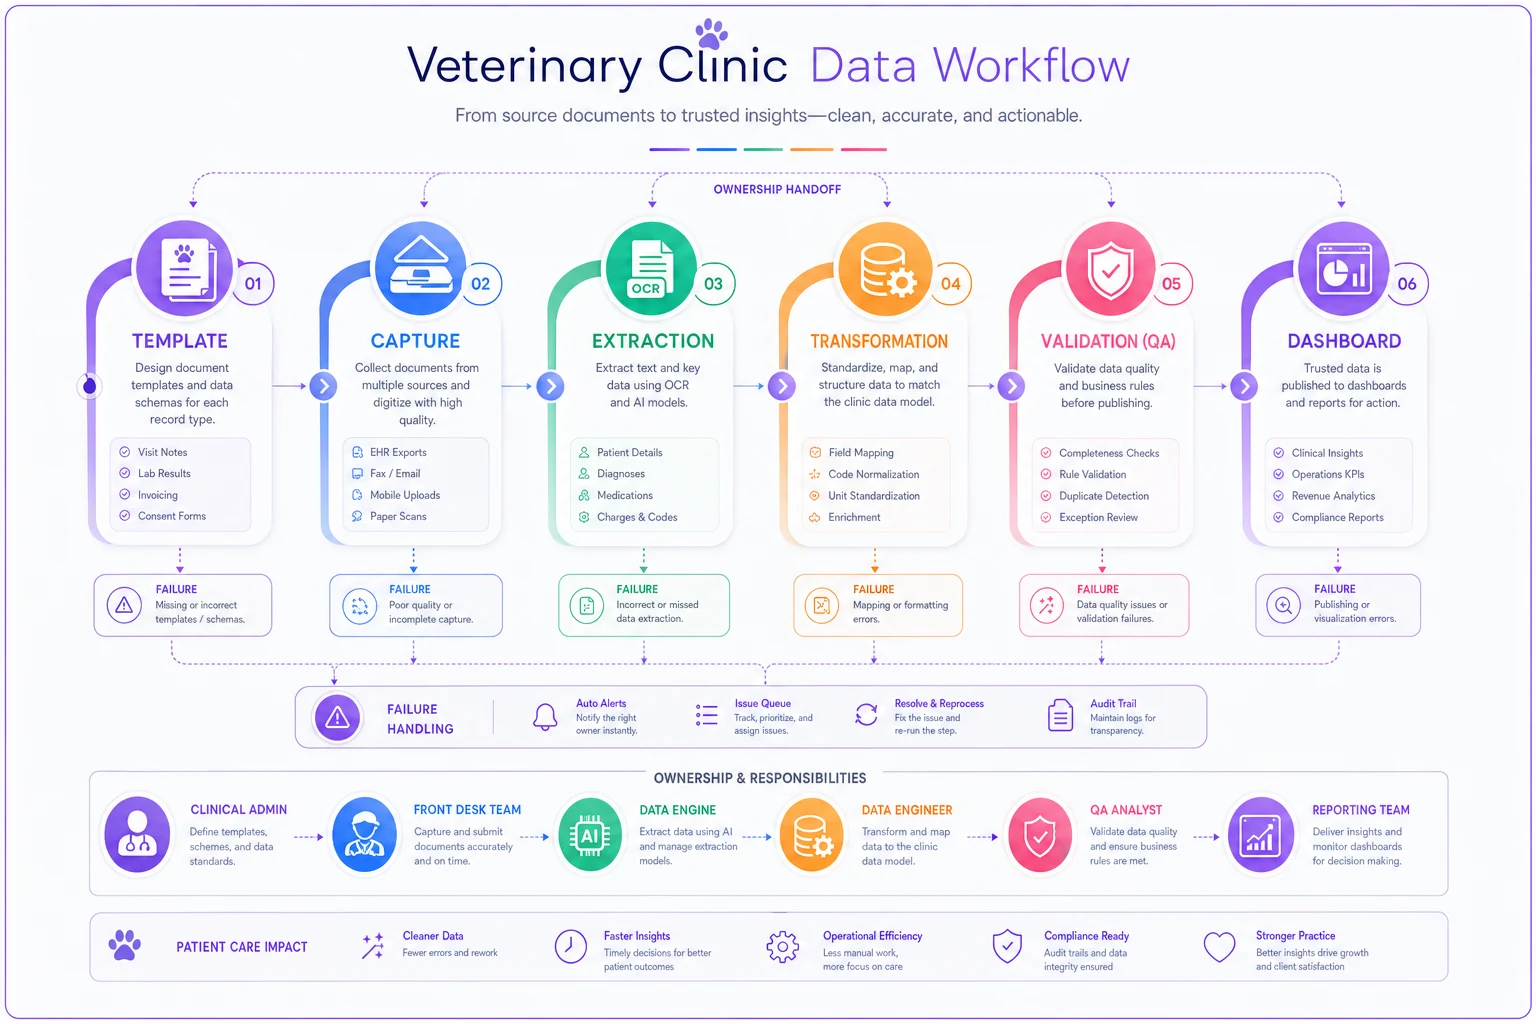
The connective tissue across all of this is documentation discipline — the same discipline that underpins data governance for your medical records lifecycle. If your underlying notes aren't audit-ready and consistently structured, nothing downstream can be either.
Mapping templates to datasets (the step most clinics skip)
Almost nobody does this, and it's probably the single highest-leverage thing on this list: an explicit map from every template field to every dataset column that depends on it.
Think of it as a dictionary. On the left, the field as staff see it ("Weight at intake"). On the right, where it lands and what feeds off it (intakeweightkg → used in anesthesia dosing report, obesity trend dashboard, and wellness plan eligibility).
-
Source field name as it appears in the template
-
Target dataset column and data type
-
Transformation logic in plain language (how raw becomes clean)
-
Downstream consumers — every report or tile that uses it
-
Owner — the one person accountable for this field's integrity
-
Last validated date
That last field matters more than people expect. A mapping that's never re-checked is a mapping that's slowly lying to you.
Pro-tip: Keep the mapping in a single, versioned source of truth that both clinicians and analysts can access.
Once you have the map, every template change becomes a visible change. Someone wants to split "Weight at intake" into "Pre-sedation weight" and "Post-fluid weight"? You can immediately see that three downstream reports depend on the old field, and you handle them before the dashboard breaks instead of after.
QA scripts: the layer between "data" and "trustworthy data"
Most clinics validate data by having a human eyeball the report and go "hm, that seems about right." That doesn't scale past a few hundred records a month, and it catches almost nothing.
QA scripts are automated checks that run before data hits a dashboard. They don't need to be fancy. They need to be consistent. The goal is to catch the handful of error types that cause most trust failures.
-
Completeness — flag records missing fields that should never be empty (species, weight, date of service).
-
Range sanity — a 340 kg cat is a typo; a vaccine dated in 2041 is a typo. Catch impossible values.
-
Referential integrity — every invoice line should tie to a patient and a visit. Orphaned records are a classic dashboard poison.
-
Category drift — if a free-text field is feeding a category count, flag values that don't match the known list ("canine" vs "Canine" vs "dog").
-
Reconciliation — totals in the analytics dataset should match totals in the source system. If visit counts differ by more than a rounding margin, something dropped in extraction.
The pattern across clinics that actually trust their numbers: every dashboard tile has a corresponding QA check, and the dashboard refuses to update if the check fails. A broken number should be visibly broken, not silently wrong. A stale-but-honest "data failed validation" banner is infinitely more useful than a fresh-looking lie.
This is where an analytics-aware operational platform earns its keep — not by generating prettier charts, but by running these validation scripts on a schedule and surfacing failures before anyone makes a decision on bad data. The value isn't the dashboard. It's the guardrail in front of it. That same philosophy — letting the data drive decisions only once it's been validated — is the backbone of a real clinical data and analytics strategy.
Ownership: the quietest failure point
Ask who owns your medication dispensing log and you'll get an answer. Ask who owns the definition of "active patient" in your analytics, and you'll usually get a shrug or a committee.
Shared ownership of a data definition is the same as no ownership. If three people can change how "new client" is counted and none of them has to tell the others, the number means nothing by Q3.
-
the field's definition staying stable (or changing deliberately)
-
approving any template change that touches it
-
confirming the QA checks on it still make sense
The fix is boring and it works: every field in your mapping has exactly one named owner. Not a department. A person. That person is accountable for the items above. When "active patient" is owned by the practice manager, and the definition is written down, and changing it requires their sign-off, the number becomes a stable instrument instead of a moving target. That stability is the entire point of analytics. A metric that quietly redefines itself every few months is worse than no metric, because it gives you false confidence.
Change-control for schema evolution
Your templates should evolve. New services, new regulations, new clinical protocols — the schema has to keep up. The problem isn't change. It's uncontrolled change.
A lightweight change-control process that fits a clinic, not a software company:
-
Proposal — someone requests a template or field change, in writing, with the reason.
-
Impact check — pull up the mapping and list every downstream dataset and dashboard affected.
-
Owner sign-off — the owners of every affected field approve or push back.
-
Update in order — change the extraction and transformation logic first, then the template, so analytics never lags the field.
-
Re-validate — run the QA scripts against the new structure before anything goes live.
-
Log it — record what changed, when, why, and who approved it.
Step 4 is the one everyone gets backwards. Clinics change the template on a Monday and "get to the reporting later." That gap — even a week — is where the dashboard breaks and trust dies. Fix the pipe, then open the tap.
The log in step 6 isn't bureaucracy. When a number looks weird three months from now, the change log tells you in thirty seconds whether a schema change explains it. Without the log, you're reverse-engineering your own history.
A deployment checklist for a trustworthy dashboard
Before any dashboard goes live — or any existing one gets a new tile — run it through this. If you can't check every box, it's not ready.
-
Every tile traces to a documented source field in the mapping
-
Every tile has a written definition a new hire could understand
-
Every calculation has QA checks that run before refresh
-
The dataset reconciles against source-system totals
-
Each underlying field has exactly one named owner
-
Known edge cases (transfers, voids, re-dos) are handled explicitly
-
There's a visible "last validated" timestamp
-
Failed validation produces a visible banner, not a silent update
-
A rollback plan exists if the new version is wrong
The clinics that skip this ship dashboards fast and abandon them within a quarter. The ones that follow it ship slower and actually keep using what they built.
A real scenario
A three-doctor small-animal practice had a "wellness plan compliance" dashboard that leadership had stopped trusting. The reported compliance rate bounced between roughly 40% and 70% month to month with no real-world explanation, so everyone ignored it and ran the practice on gut feel.
The problem traced back through the pipeline in under a day once someone actually mapped it. Two different template versions were live — an older exam form with a structured "enrolled in plan?" checkbox, and a newer one where staff typed plan status into a note field. The report only read the checkbox. Every patient documented on the new form showed as not enrolled, which dragged the number down whenever that form got heavier use.
The fix wasn't a new dashboard. It was the operating model: one owner for the "plan enrolled" definition, a single structured field both forms wrote to, a QA check flagging any record where plan status was blank, and a change log so it couldn't drift again. The compliance number settled into a stable low-80s range — not because compliance improved overnight, but because they were finally measuring the same thing every month. Within a couple of months the doctors started using that tile to drive recheck conversations again. The dashboard didn't get smarter. It got trustworthy.
When this level of rigor makes sense — and when it doesn't
When it's worth it: You're running multiple doctors, multiple templates, or multiple locations, and more than one person touches both documentation and reporting. The moment template-writers and report-builders are different people, you need the mapping and change-control or drift is guaranteed.
When it's overkill: A solo practitioner running one template with a handful of numbers they check by hand doesn't need formal change-control. The whole pipeline lives in one head, and that head knows when something changed. Building a governance process for that is motion without progress.
Who should NOT start here: If your underlying records are still inconsistent — fields skipped, free-text everywhere, no documentation standard — fixing analytics governance first is building the second floor before the foundation. Get the documentation lifecycle solid, then layer this on top. Clean templates feed clean datasets; messy templates feed confident nonsense no matter how good your QA scripts are.
Pulling it together
The dashboard is the last 5% of the work and gets 95% of the attention. That ratio needs to flip.
The trustworthy clinics aren't the ones with the prettiest charts — they're the ones who can point at any number and walk you backward through the transformation, the validation check, the owner, and the exact template field it came from. That traceability is what documentation to analytics veterinary work actually means in practice.
Map the templates to the datasets. Script the QA. Give every field one owner. Control the schema changes in the right order. Run the deployment checklist before anything goes live. Do that consistently and your numbers stop being a source of arguments and start being something people actually act on. Skip it, and you'll keep paying for dashboards that everyone quietly rebuilds in a spreadsheet — which is the most expensive way to not have analytics at all.
Do that consistently and your numbers stop being a source of arguments and start being something people actually act on. Skip it, and you'll keep paying for dashboards that everyone quietly rebuilds in a spreadsheet — which is the most expensive way to not have analytics at all.
Ready to elevate your clinic’s efficiency?
Join 500+ veterinary clinics using Veterinaryly to save time, reduce administrative overhead, and improve patient care.