



Most clinics don't have a data problem. They have a data capture problem that quietly poisons everything downstream. The reports look fine on the surface, but when you try to answer a real question — "How many of our diabetic patients hit glycemic control within 90 days?" or "Which surgeons have the lowest post-op complication rate?" — you hit a wall. The fields weren't filled in. The values were free-text. Half the outcomes were never recorded because nobody agreed on what "recovered" even means.
A veterinary clinical data analytics strategy isn't about buying a fancier reporting tool. It's about deciding, upfront, what you're going to measure, how it gets captured at the point of care, and how those measurements connect to money and medicine. Get that wrong and you'll spend years generating numbers you can't act on.
The core failure: analytics built on top of garbage capture
Here's the pattern that repeats in almost every clinic that hits this wall. Someone — usually the owner or a keen associate — builds a dashboard. It pulls revenue, appointment counts, maybe average transaction value. It looks impressive for about two weeks. Then people stop looking at it, because the numbers don't match reality and nobody can explain why.
The reason is almost never the dashboard. It's that the underlying records were never structured to answer clinical questions. Diagnoses live in the notes as free text ("looks like early CKD, will monitor"). Outcomes are implied, not recorded. Body weight gets entered inconsistently — sometimes in kg, sometimes in lbs, sometimes skipped entirely. When you try to aggregate any of that, you get noise.
Analytics quality is capped by capture quality. You cannot report your way out of bad data entry. If a field isn't mandatory, structured, and defined at the moment of the visit, no downstream tool will save it. This is why data governance and analytics are really the same project — and why it's worth reading how an operational lifecycle for audit-ready medical records sets the foundation everything else sits on.
Start with the schema, not the dashboard
Before anyone opens a reporting tool, you need to agree on your mandatory clinical fields — the small set of structured data points that every relevant visit must capture. Not fifty fields. The ones that actually feed outcomes and revenue.
Never miss a pet’s appointment again.
Veterinaryly helps you schedule, confirm, and manage every appointment and patient record effortlessly.
- Centralized appointment & patient management
- Automated client reminders
- Staff scheduling & task tracking
No credit card required
| Field | Type | Why it matters | Mandatory when |
|---|---|---|---|
| Presenting complaint | Coded (pick-list) | Enables case-type analysis | Every visit |
| Primary diagnosis | Coded (SNOMED-style or internal list) | Foundation for outcome tracking | Any diagnostic visit |
| Body weight + unit | Numeric + enforced unit | Dosing, trend tracking, chronic disease | Every visit |
| Body condition score | 1–9 scale | Nutrition + chronic disease outcomes | Wellness, chronic |
| Procedure/service code | Coded | Ties clinical work to revenue | Every billable action |
| Outcome status | Coded (resolved / improved / stable / declined / deceased) | The metric everyone forgets | Follow-up and discharge |
| Recheck scheduled? | Boolean + date | Continuity + revenue capture | Chronic + post-op |
The single most-skipped field on that list is outcome status. Clinics record what they did obsessively — every service, every dispense — but rarely record what happened. Without a coded outcome field, you can measure activity forever and never measure results. That's the gap between a busy clinic and one that can actually prove it delivers good medicine.
One practical rule: free-text is fine as a supplement, never as the source of truth for anything you want to measure. Notes are for nuance. Coded fields are for analytics. When those two get blurred, your data becomes unqueryable.
Define outcomes that map to revenue — before you collect anything
This is where most strategies quietly die. People define metrics that are easy to pull instead of metrics that mean something. Appointment count is easy to pull. It's also nearly useless on its own.
-
Chronic disease control rate — % of enrolled chronic patients (diabetes, CKD, thyroid) hitting target markers within a defined window. Ties directly to recheck revenue and retention, since controlled patients stay in the practice.
-
Post-op complication rate — complications per 100 surgeries, defined precisely (what counts as a complication, over what window). Drives cost, reputation, and rework.
-
Recheck compliance rate — % of recommended rechecks actually booked and attended. One of the biggest hidden revenue leaks in general practice.
-
Dental follow-through rate — % of grade 2–3 dental recommendations that convert to a scheduled procedure. A clean bridge between clinical need and revenue.
-
Preventive care coverage — % of active patients current on core preventives. Predicts lifetime value more reliably than almost anything else.
The discipline here is writing a precise definition for each metric, including the numerator, denominator, and time window. "Complication rate" means nothing until you specify: complications recorded within 14 days of surgery, divided by total surgeries in the period, where complication is one of these six coded values. Vague definitions produce arguments, not decisions.
More metrics is not better. A focused set of eight to twelve well-defined outcome metrics beats a dashboard of forty. We've covered before how tracking the wrong KPIs quietly bleeds revenue — the same principle applies with even more force to clinical data, because a misleading clinical metric doesn't just cost money, it leads to worse patient decisions.
The capture rules are the whole game
You can have a perfect schema and perfect metric definitions and still end up with unusable data if capture is inconsistent. This is the unglamorous middle layer that makes or breaks everything.
A few rules that consistently pay off:
-
Enforce units at entry. Weight, temperature, dosing — the field should reject a bare number and demand a unit, or lock the unit entirely. Unit ambiguity is a silent killer in trend data.
-
Pick-lists over free-text for anything you'll aggregate. If you want to count it later, it must be a controlled value now.
-
Make outcome fields required at discharge and recheck, not optional. If the record can close without an outcome, most will.
-
One diagnosis field is primary and coded. Comorbidities go in secondary structured fields, not stuffed into the primary.
-
Timestamp everything meaningful — not just visit date, but when results returned, when rechecks were booked, when follow-ups happened. Time-based metrics are impossible to reconstruct after the fact.
Make the right action the easy default in the EHR so staff complete mandatory fields during the normal workflow, not as an extra task.
Whenever a field is optional and inconvenient, completion rates collapse to near zero within a month, no matter how much you train. Staff aren't lazy — they're busy, and optional friction always loses to a full waiting room. The fix is making the right action the easy default, not sending another reminder email.
A realistic backlog: you can't build it all at once
Nobody builds a full analytics system in one go. The clinics that succeed treat it as a prioritized backlog and ship one workstream at a time. The ones that fail try to boil the ocean, stall out, and abandon the whole effort.
-
First
revenue leak detection.
Recheck compliance and missed follow-ups. Low effort, immediate money. -
Second
chronic disease tracking.
High clinical and financial value, moderate setup. -
Third
surgical/procedure outcomes.
High value but needs clean coded capture first, so it comes after your schema is enforced. -
Fourth
preventive care coverage.
Strong long-term LTV signal, but slower to pay off. -
Later
benchmarking across doctors or locations.
Only meaningful once capture is consistent enough that comparisons are fair.
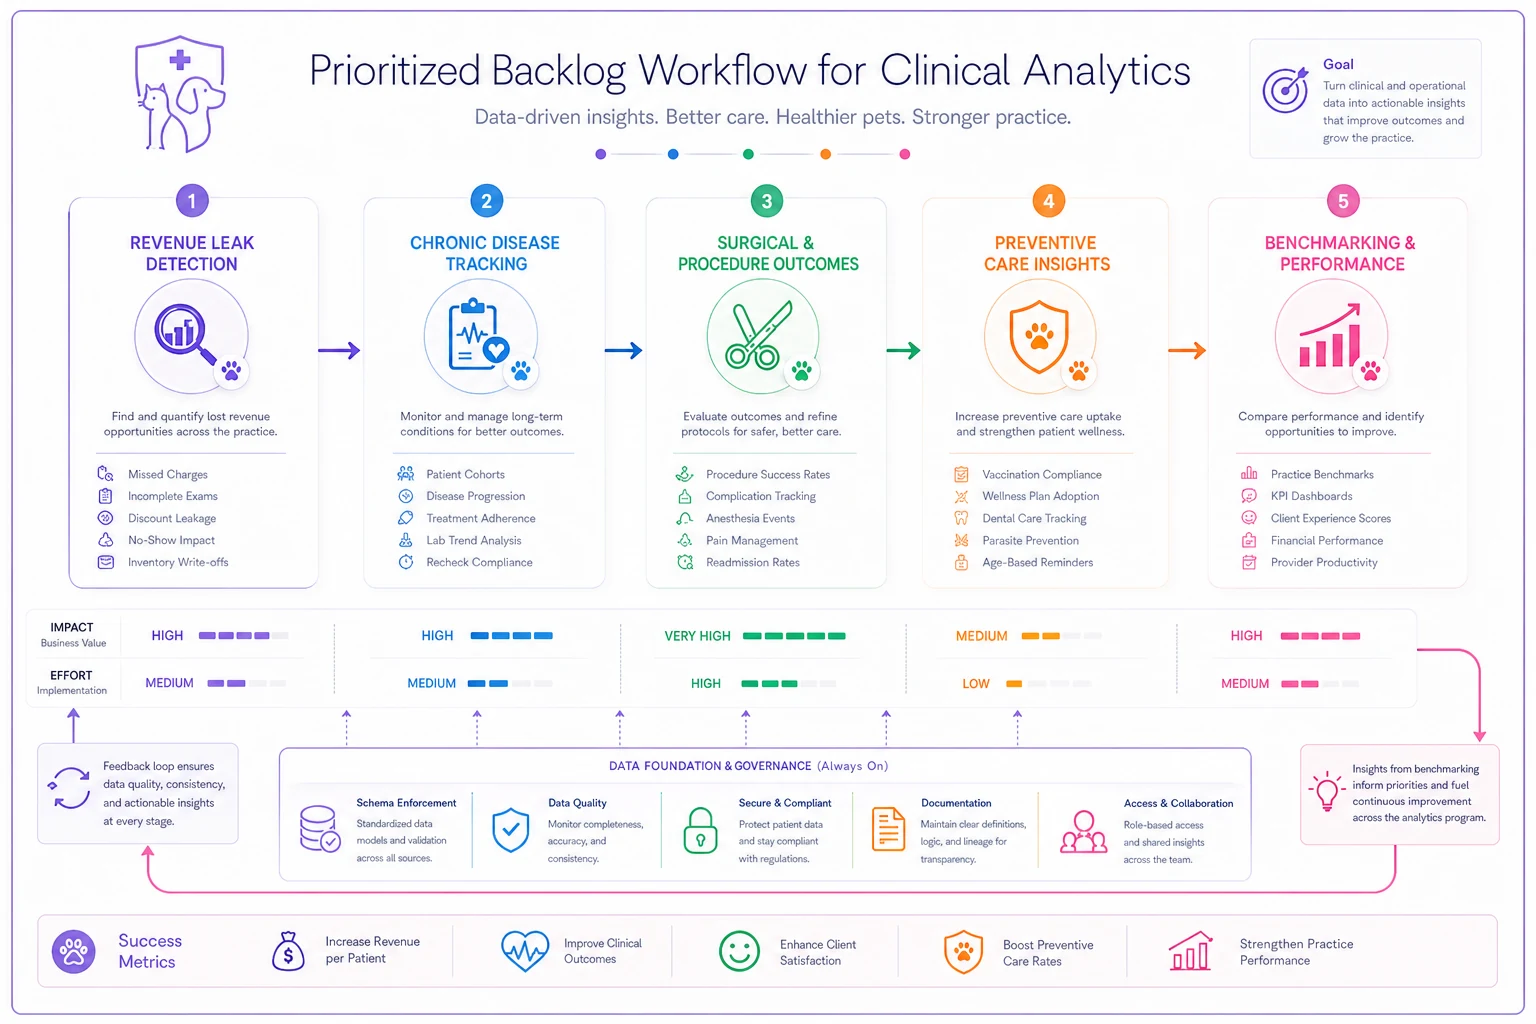
The diagram highlights sequencing and prerequisites so teams focus on the smallest high-impact work first.
That last point matters more than people expect. Do not benchmark doctors against each other until your data is clean. Comparing complication rates when one vet documents diligently and another barely codes anything isn't analysis — it's punishing honesty. That's a fast way to get everyone to stop documenting.
Example dashboards that people actually use
The dashboards worth building answer a specific question for a specific person and lead to an action. Everything else is decoration.
Clinical quality view (for the medical director):
-
Complication rate by procedure type, trended monthly
-
Chronic disease control rate by condition
-
Outcome distribution (resolved / improved / stable / declined) for major case types
Revenue-continuity view (for the owner/manager):
-
Recheck compliance rate and dollar value of missed rechecks
-
Dental and diagnostic recommendation follow-through
-
Preventive coverage across the active patient base
Daily operations view (for the front and clinical teams):
-
Rechecks due this week that aren't yet booked
-
Open outcomes (discharged patients with no recorded result)
-
Pending results past their expected return window
Notice the daily view is a worklist, not a report. That's the difference between analytics that changes behavior and analytics that gets admired and ignored. A number tells you how you did last month. A worklist tells someone what to do before lunch.
Structured measurement like this also feeds directly into broader quality work — it's the raw material behind turning clinical variation into predictable outcomes, because you can't reduce variation you can't see.
What breaks at scale
Everything above is manageable for a single-site clinic where the owner sees most cases and roughly knows what's happening. It breaks in predictable ways as you grow.
With one location, inconsistent capture is annoying. With four locations and twelve doctors, it becomes structurally impossible to compare anything — because each site drifts into its own coding habits, its own free-text shortcuts, its own definition of "resolved." You end up with four datasets that look similar and can't be combined.
The coordination problem is the real scaling wall. When capture standards live in someone's head, they don't survive the third new hire. What scales is a written schema, enforced field rules in the practice management system, and a small governance routine that reviews completion rates and deliberately adds or retires metrics. Without that, more locations just means more inconsistent data, faster.
This is also where AI-assisted operational tooling earns its place — not as a magic report generator, but in the boring, high-value work: flagging records with missing outcome fields before they close, surfacing rechecks that slipped, catching a diagnosis typed as free-text when it should've been coded, nudging a worklist when results sit past their window. The value isn't intelligence for its own sake. It's removing the manual policing that no human team can sustain across hundreds of visits a week. Good software should make correct capture the path of least resistance, then quietly watch for the gaps.
A short real scenario
A three-doctor small-animal practice running roughly 340–380 visits a week felt "busy but flat." Revenue was steady, but they couldn't explain why chronic patients seemed to churn.
When they enforced a coded outcome field and a recheck-scheduled flag, the first month's data was ugly: only about 40% of recommended rechecks for chronic patients were actually on the books. Nobody had been tracking it, so nobody knew. The missed rechecks weren't a clinical failure — they were a capture and follow-up failure. Patients were slipping through because the recall lived in nobody's queue.
They built a single weekly worklist of "chronic rechecks due, not yet booked" and assigned it to one team member. Over the next quarter, recheck booking climbed into the 60–70% range. The clinical upside was better-controlled patients; the financial upside was several thousand dollars a month in previously invisible recurring revenue — money that already belonged to them, just uncaptured. No new marketing, no new services. Just measuring the right thing and acting on it.
When this is worth it — and when it isn't
When it makes sense: you're past the point where one person can hold the whole clinical picture in their head, you have recurring chronic or surgical caseload, or you're growing toward multiple doctors or sites. The payoff scales with complexity.
When it's a bad idea to overdo it: a brand-new solo practice with fifty active patients doesn't need a twelve-metric analytics program. It needs clean capture habits and two or three numbers. Building an elaborate dashboard before you have enough volume to make it meaningful is a good way to burn energy on charts nobody needs yet.
Who should not start here: if your records are currently a mess and staff aren't documenting reliably, fix capture discipline first. Analytics layered on inconsistent capture will just formalize the confusion and give you confident-looking wrong answers — which is worse than no answer at all.
The takeaway
A clinical data strategy lives or dies on one decision made early: are you measuring activity, or are you measuring outcomes? Activity is easy to capture and tells you almost nothing about whether patients are getting better or whether revenue is leaking. Outcomes are harder to capture — they demand a schema, defined metrics, and enforced capture rules — but they're the only thing that connects the medicine to the money.
Start small. Enforce a handful of mandatory coded fields. Define eight to twelve outcome metrics with precise numerators and denominators. Build one worklist that changes what someone does tomorrow morning. Then expand. The clinics that get this right aren't the ones with the prettiest dashboards — they're the ones whose data is trustworthy enough that people actually make decisions from it.
A clinical data strategy lives or dies on one decision made early: are you measuring activity, or are you measuring outcomes? Activity is easy to capture and tells you almost nothing about whether patients are getting better or whether revenue is leaking. Outcomes are harder to capture — they demand a schema, defined metrics, and enforced capture rules — but they're the only thing that connects the medicine to the money.
Ready to elevate your clinic’s efficiency?
Join 500+ veterinary clinics using Veterinaryly to save time, reduce administrative overhead, and improve patient care.