


Two surgeons in the same clinic can run the same procedure and land in completely different places. One has a 3% post‑op complication rate. The other sits closer to 9%. Same building, same equipment, same anesthesia protocols on paper. The difference is variation — the quiet gap between how care is supposed to happen and how it actually happens on a busy Thursday afternoon.
Most clinics never see this gap because nobody's measuring it in a way that connects to anything. Complication rates get talked about anecdotally. Readmissions get logged as "recheck" and disappear into the calendar. Adherence gets treated as the client's problem. And because none of it feeds back into how the clinic runs, the variation just repeats.
Veterinary clinical quality management isn't about chasing a perfect outcome number. It's about building a loop — measure the outcome, adjust for the fact that some patients are just sicker, audit the process that produced the outcome, fix what's broken, and review it on a schedule that doesn't slip. When that loop is missing even one piece, it collapses into finger‑pointing.
Why raw outcome numbers lie to you
The trap almost every clinic falls into the moment they start tracking outcomes: comparing doctors, technicians, or locations using unadjusted numbers.
A doctor who takes the hardest cases — the geriatric patients, the emergency splenectomies, the diabetics who show up in crisis — will always look worse on a raw complication rate. Rank people on those numbers and you punish the ones doing the difficult work while rewarding the ones cherry‑picking healthy patients. Within a year, your best clinicians stop taking risky cases, and your quality "improvement" has quietly made patient care worse.
This is why risk adjustment isn't a statistical luxury. It's the thing that makes the whole framework fair enough that people actually trust it. Without it, staff learn to game the metric instead of improving the work.
Risk adjustment in a clinic doesn't need to be a regression model. It needs to be a small set of honest rules everyone agrees on:
| Risk Factor | Adjustment Category | How It Affects Interpretation |
|---|---|---|
| ASA status III–V | High‑risk | Higher expected complication baseline |
| Age > 10 years (dog) / > 12 (cat) | Moderate‑risk | Slightly elevated expected readmission |
| Emergency vs. scheduled | High‑risk | Expected higher complication + longer stay |
| Comorbidities (renal, cardiac, endocrine) | Moderate‑to‑high | Adjust adherence and readmission expectations |
| BCS extremes (<3 or >8) | Moderate‑risk | Wound healing, anesthesia recovery variance |
The point isn't precision. It's that when you look at a 9% complication rate, you can ask: was this a high‑risk caseload or a process problem? Those are two completely different conversations, and unadjusted data can't tell them apart.
The three outcomes worth building a system around
You can drown a clinic in metrics. Most of them don't change any decision, which means they're noise with a spreadsheet attached. If you're building a quality framework from scratch, three outcomes carry most of the weight.
Never miss a pet’s appointment again.
Veterinaryly helps you schedule, confirm, and manage every appointment and patient record effortlessly.
- Centralized appointment & patient management
- Automated client reminders
- Staff scheduling & task tracking
No credit card required
Complication rates tell you whether the care itself is sound — but only when they're defined tightly. "Complication" has to mean the same thing to every doctor. Surgical site infection, dehiscence, unplanned anesthesia event, whatever your list is — it needs a written definition, because otherwise one doctor logs a mild seroma as a complication and another ignores it entirely, and your data becomes fiction.
Readmissions and unplanned rechecks tell you whether the patient actually recovered or just left the building. This is where clinics lose the plot most often. A patient comes back three days post‑op with a problem, gets seen by a different doctor, gets coded as a fresh recheck, and never links back to the original procedure. The surgeon has no idea their case bounced. You're not measuring outcomes at that point — you're measuring calendar entries.
Adherence is the one everyone underweights. If 40% of your chronic patients aren't completing recommended monitoring or refilling medications, your clinical outcomes are being shaped by something happening after the patient walks out. Adherence connects clinical quality to the operational side of the business — recall systems, follow‑up cadence, client communication — which is exactly why it belongs in the same framework and not siloed off in the "marketing" bucket.
Where the framework breaks as the clinic grows
A solo practice with one doctor doesn't really need a quality framework. That doctor holds the whole picture in their head. They remember which cases went sideways, they see their own rechecks, and correction happens more or less automatically.
The trouble starts at the second doctor, and gets worse from there. Here's the progression across most growing practices:
-
Two to three doctors Variation appears but nobody names it. Cases get handed between doctors and small differences in protocol start compounding.
-
Four to six doctors + multiple shifts Nobody sees the full arc of a patient anymore. A complication caught on a night shift never reaches the doctor who did the surgery. Institutional memory fragments.
-
Multi‑location Two clinics run the "same" SOP but interpret it differently, and there's no mechanism to notice the drift until a serious event forces a review.
The failure at scale is almost never a knowledge problem. It's a feedback problem — information about what happened never travels back to the person who could change it. This is the same structural issue that shows up in peri‑operative handoffs, where a case falls apart not because anyone lacked skill, but because information didn't move cleanly between the people responsible for it.
Audits that live inside the work, not on top of it
The single biggest reason quality programs die is that the audit is a separate thing someone has to remember to do. A quarterly chart review that one manager runs when they have a free afternoon will always slip. The workload wins.
The fix is embedding the audit into the SOP itself, so completing the work is completing the audit. A discharge SOP that includes a two‑line check — "post‑op instructions confirmed, recheck scheduled, medication reconciliation done" — captures adherence data at the moment the work happens, not weeks later when someone tries to reconstruct it from memory.
Quality management is downstream of good process design. If your SOPs are already tight, embedding an audit checkpoint is trivial. If they're loose, you're auditing chaos. It's worth getting the underlying process right first — the same thinking laid out in the clinical SOP playbook applies directly here, because a quality framework is really just an SOP that measures itself.
A workable embedded‑audit flow looks like this in practice:
-
Trigger point defined in the SOP — every surgical discharge, every diabetic recheck, every anesthesia event.
-
Micro‑check completed at the moment of care — a few required fields, not a form. Thirty seconds, not thirty minutes.
-
Flagged cases route automatically — anything outside the expected range (complication, early readmission, missed follow‑up) gets tagged for review instead of relying on someone to notice.
-
Weekly rollup — flagged cases only, not everything. You review exceptions, not the whole haystack.
-
Pattern check monthly — are the same flags clustering around a doctor, a shift, a procedure, a location?
Here's a short visual of that embedded audit flow.
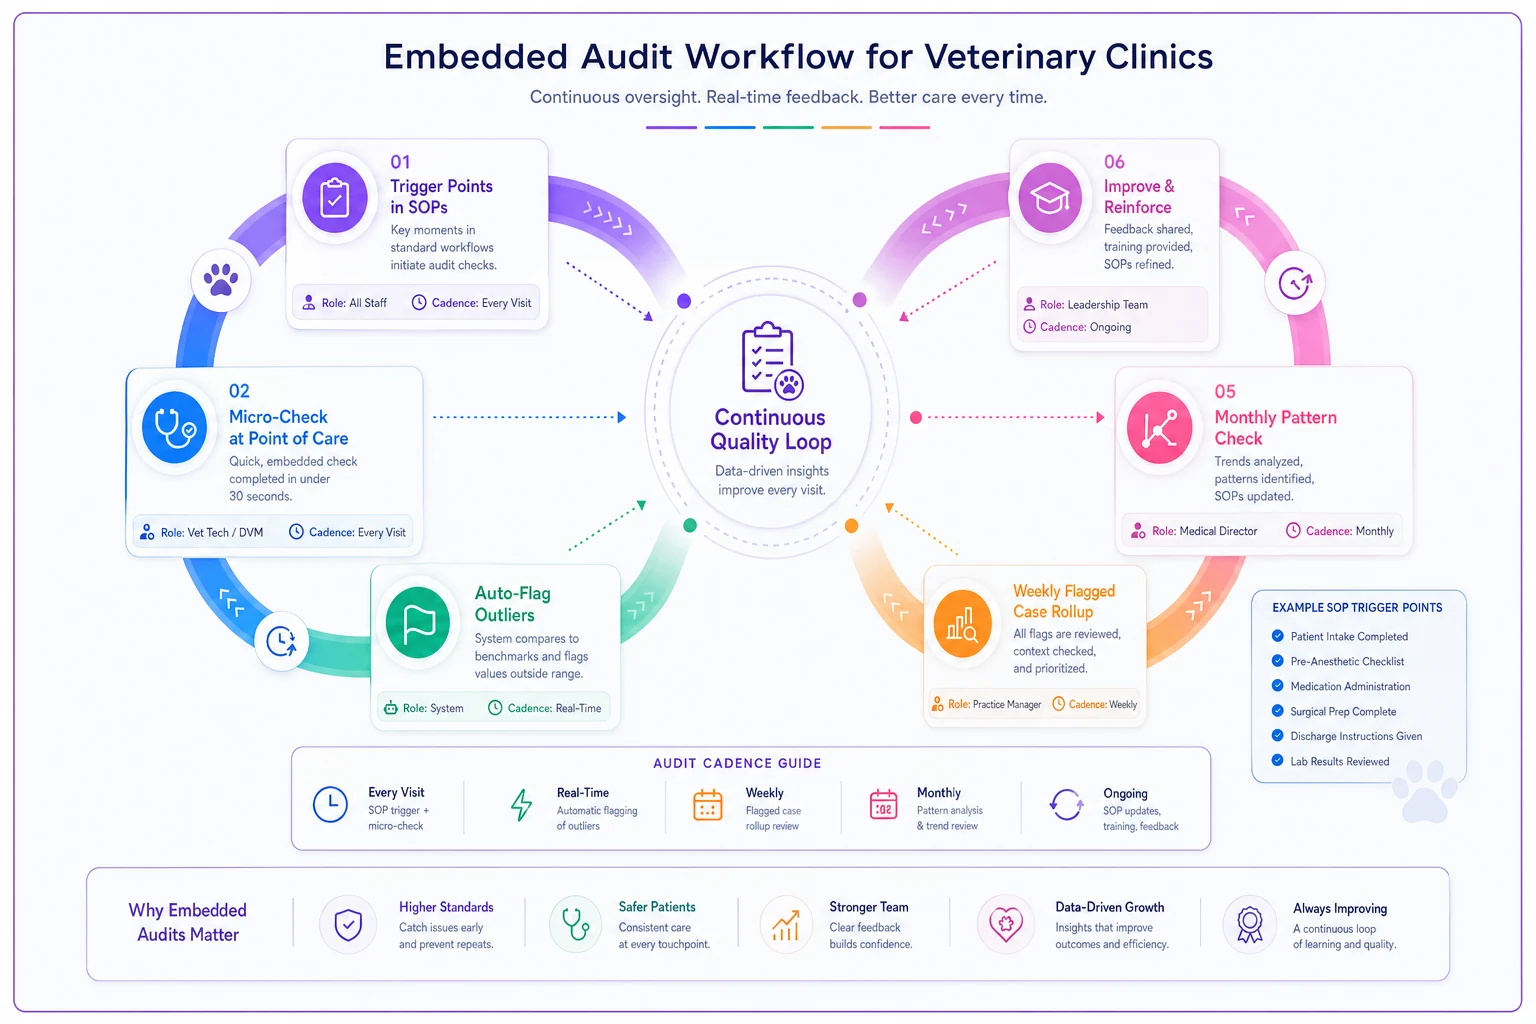
Keep micro‑checks to thirty seconds so staff see them as part of the task, not extra work.
The design principle: humans should only be looking at outliers. If your audit requires someone to read every chart, it will fail by month three.
Sample dashboard: what a doctor and an owner each need to see
A dashboard that shows everything shows nothing. Building one giant screen and expecting people to find meaning in it is a mistake. Different roles need different views.
The clinician's view should be personal and risk‑adjusted:
-
My complication rate this quarter vs. my risk‑adjusted expected rate
-
My unplanned readmissions, linked back to the original case
-
Adherence rate for my chronic patients
-
A short list of my flagged cases with what triggered the flag
The owner's / medical director's view should be about patterns and drift:
-
Complication rates by procedure, risk‑adjusted, across the whole team
-
Readmission trends by location and by shift
-
Adherence by care pathway (are diabetics slipping? renal patients?)
-
Which SOPs are generating the most flags
The reason to separate these is behavioral. When a doctor sees only their own risk‑adjusted numbers, it's information they can act on. When they see themselves ranked against colleagues on a leaderboard, it becomes politics — people start managing the number instead of the patient.
Remediation: what happens when a flag fires
Measuring problems and never fixing them is worse than not measuring at all, because now everyone knows the data is ignored. Remediation is where most frameworks reveal whether they're real.
A flagged case needs a defined path, not a vague "we'll look into it." A simple root cause analysis checklist keeps the review honest and prevents it from turning into blame:
-
What was the actual outcome, and was it truly outside the risk‑adjusted expectation?
-
Was the SOP followed? (If yes, the SOP might be the problem, not the person.)
-
Where in the workflow did the deviation happen — pre‑op, intra‑op, discharge, follow‑up?
-
Was this a one‑off, or does it match a pattern across recent flags?
-
Is the fix a training issue, a process issue, or a resource issue?
-
Who owns the fix, and when do we check whether it worked?
That last line matters most. A remediation without a follow‑up date isn't a fix — it's a note. The clinics that actually improve are the ones where every remediation has an owner and a re‑check date, and both get surfaced at the next governance meeting.
The most common mistake in remediation is jumping straight to "retrain the doctor" for what is actually a process failure. If three different doctors all miss the same follow‑up step, the problem isn't three doctors — it's a discharge workflow that makes the step easy to skip. Fix the workflow and the "human error" usually disappears.
Governance cadence: the meeting that keeps it alive
None of this survives without a rhythm. A quality framework with no meeting cadence decays into a dashboard nobody opens. But governance in a clinic doesn't mean bureaucracy — it means a short, predictable review where flagged cases and open remediations actually get looked at.
A cadence that holds up across most growing practices:
| Cadence | Attendees | Focus |
|---|---|---|
| Weekly (15 min) | Shift/floor lead | Review new flags, confirm nothing urgent is sitting open |
| Monthly (45–60 min) | Medical director + lead techs | Patterns, open remediations, SOP flags, re‑check dates |
| Quarterly (90 min) | Owner + medical director + leads | Risk‑adjusted trends, protocol changes, structural fixes |
The weekly touch is what prevents flags from rotting. The monthly is where patterns become decisions. The quarterly is where you change protocols and adjust the risk rules themselves. Skip the weekly and everything piles up until the monthly meeting becomes a three‑hour backlog nobody wants to attend — which is how these programs quietly die.
One thing worth flagging: the meeting has to produce written decisions with owners, or it becomes a venting session. "We discussed the readmission rate" is not an output. "Dr. Chen will revise the diabetic discharge SOP by the 15th, re‑check in the March meeting" is.
A real scenario
A three‑doctor small‑animal practice was seeing a spay/neuter complication rate that felt high to the owner but nobody could pin down. Everything got logged inconsistently, and rechecks for post‑op problems were booked as generic appointments, so the true rate was invisible.
They did three things: defined "complication" in writing, linked every post‑op recheck back to its original surgery, and added a two‑field check to the discharge SOP. No fancy software at first — just a shared definition and some discipline.
Within about four months, the picture cleared up. The clinic‑wide complication rate turned out to be somewhere around 6–7%, but almost all of it clustered on higher‑risk and emergency cases — meaning the routine work was actually solid. The one real signal was a recurring dehiscence issue tied not to a doctor but to a discharge instruction that clients kept misreading. They rewrote the instruction sheet. Dehiscence rechecks dropped noticeably over the next quarter, and the owner finally had a number they trusted instead of a gut feeling.
The interesting part wasn't the improvement. It was that the "surgeon problem" they'd worried about for a year turned out to be a discharge‑paperwork problem the whole time.
When this framework makes sense — and when it doesn't
When it makes sense: You have two or more doctors, you're seeing enough surgical or chronic‑care volume that variation matters, and you've noticed outcomes you can't explain. Multi‑location practices need this more than anyone, because drift between sites is invisible without it.
When it's overkill: A true solo practice with low surgical volume doesn't need risk‑adjustment tables and governance meetings. The doctor already holds the full picture. Building heavy infrastructure here just creates admin work with no return.
Who should not do this yet: Clinics whose underlying SOPs are still inconsistent or undocumented. You can't audit a process that doesn't exist. Get the process stable first, then layer the quality loop on top. Measuring chaos just produces well‑organized chaos.
Where software quietly earns its place
Everything above can be run on paper and spreadsheets — and honestly, that's the right way to start, because it forces you to get the definitions and cadence right before automating anything. But the framework has a natural breaking point. Once you're past three or four doctors, the manual version starts eating hours: someone has to link rechecks to original cases by hand, tag flags manually, and rebuild the same rollup every week.
That's where an operational platform with AI‑assisted flagging starts paying for itself — not by making clinical decisions, but by handling the boring, error‑prone linking and routing that humans do badly at scale. The system catches the early readmission and ties it to the original surgery automatically. It surfaces outlier cases so your monthly meeting reviews exceptions instead of everything. It keeps remediation owners and re‑check dates from falling through the cracks. The judgment stays with your clinicians; the coordination and memory get offloaded to software that doesn't forget or get buried on a busy Thursday.
The goal was never a dashboard. It's a clinic where a complication in March actually changes how the same procedure runs in April — reliably, without depending on one person to remember. That feedback loop, running quietly in the background, is what turns clinical variation into outcomes you can actually predict.
Ready to elevate your clinic’s efficiency?
Join 500+ veterinary clinics using Veterinaryly to save time, reduce administrative overhead, and improve patient care.